
Heart Rate Zones in CrossFit: What Your WOD Data Actually Means
Heart-rate zones can make a CrossFit workout easier to understand, but only when you read them alongside the workout’s purpose, movements, score, pacing, and perceived effort. A zone chart shows how your cardiovascular system responded. It does not tell you by itself whether you chose the right weight, broke your pull-ups intelligently, or produced your best possible score.
That distinction matters in mixed-modal training. A five-minute barbell sprint, a 20-minute bodyweight AMRAP, and an every-minute interval session can produce similar average heart rates while placing very different demands on the athlete.
The useful question is therefore not, “Was my heart rate high?” It is, “Does the pattern match the workout I intended to perform, and what will I change next time?”
Start With the Workout’s Job
Before looking at a graph, describe the intended stimulus in one sentence:
- Was this a short sprint where transitions mattered?
- Was it a longer AMRAP that rewarded a sustainable pace?
- Was it an EMOM with deliberate recovery inside each minute?
- Was it a strength session followed by conditioning?
- Was the goal to practice a skill rather than maximize intensity?
A zone distribution is not inherently good or bad. Twelve minutes in the highest zones might be expected during a hard 15-minute test. The same result would contradict the purpose of a recovery session.
This is the foundation of a useful post-workout heart-rate-zone analysis: compare the internal response with the job of the workout before interpreting individual numbers.
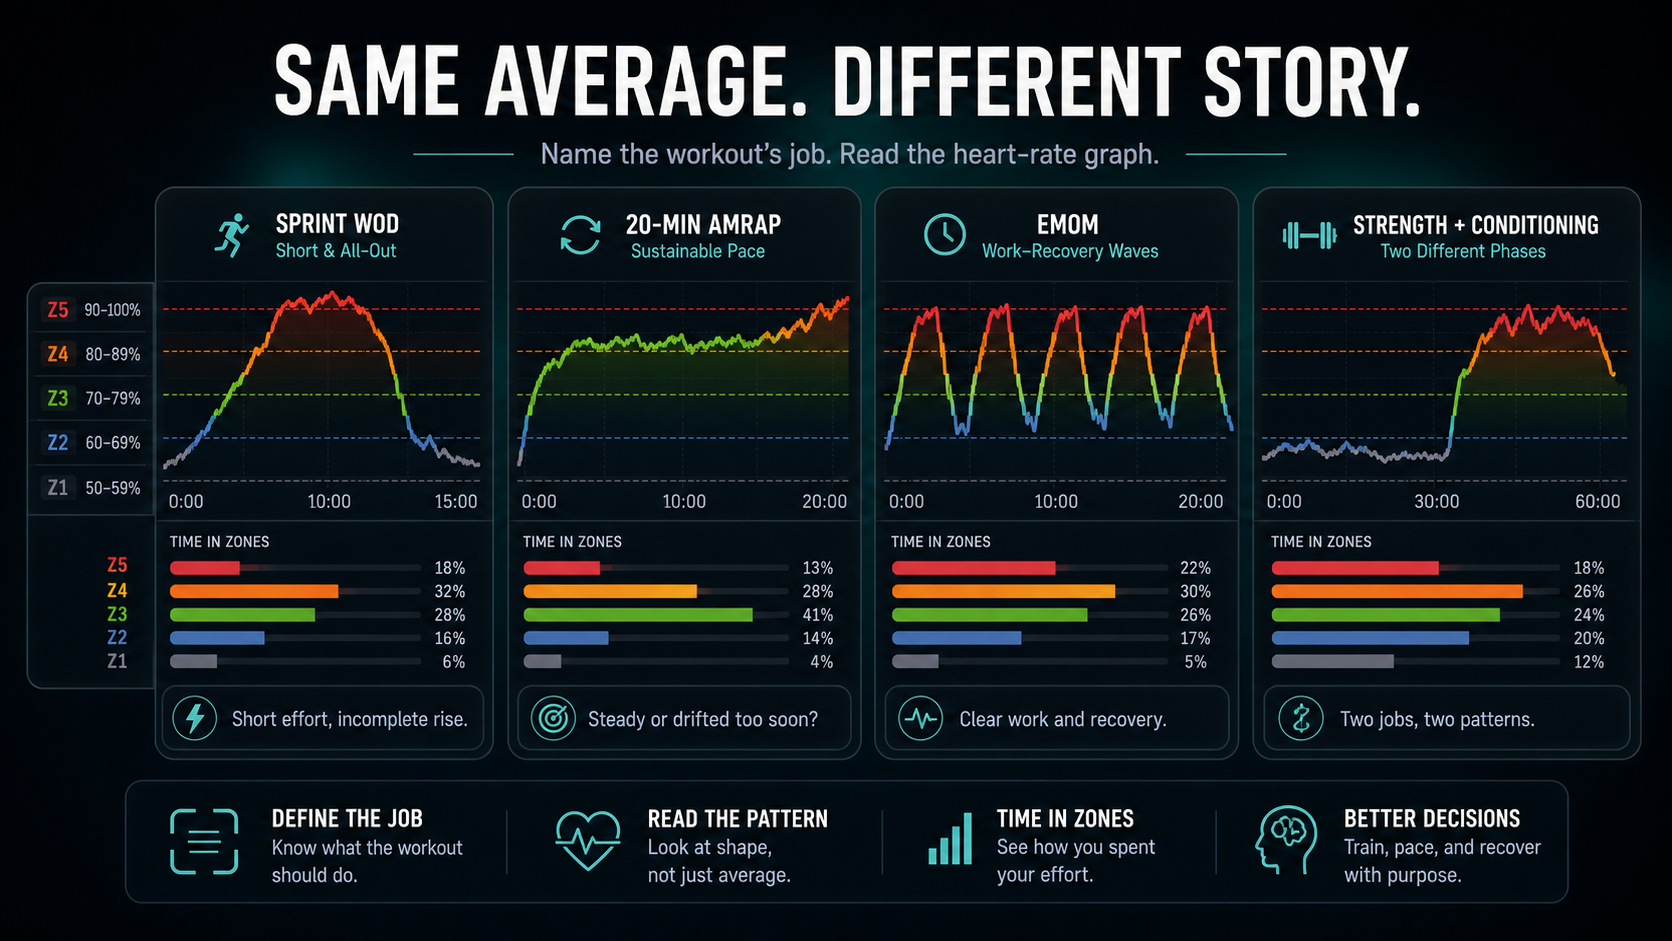
A short sprint, steady AMRAP, EMOM, and strength-plus-conditioning session should not produce identical heart-rate shapes.
Heart-Rate Zones Are Not Universal
Most watches display five zones, but the boundaries depend on the method used. They may be estimated from age, a recorded maximum heart rate, heart-rate reserve, or a tested threshold. A Zone 3 label in one system may not represent exactly the same physiological intensity in another.
This is why two athletes should not compare zone percentages without first comparing their settings. It is also why an age-based default can be misleading for an individual whose actual maximum heart rate differs substantially from the estimate.
Heart rate remains valuable. The classic review by Achten and Jeukendrup describes it as a practical training measure while emphasizing that temperature, dehydration, day-to-day variability, and the relationship between heart rate and oxygen consumption affect interpretation (Sports Medicine). Treat the zones as a consistent personal framework, not a universal scoreboard.
How Common CrossFit Formats Look
Short sprint WOD
In a two- to six-minute workout, muscular effort and breathing may become maximal before heart rate reaches its highest value. Heart rate responds with a delay, especially when the work begins suddenly. The peak may even appear near the end or immediately after the last repetition.
Low recorded time in Zone 5 does not prove that a short sprint was too easy. Your split times, bar speed, failed repetitions, transitions, and rating of perceived exertion may describe the effort better.
For a benchmark such as Fran, the most useful heart-rate observation may be when the rise accelerated relative to your movement breakdown. Did the first 21 thrusters create a cost that appeared during the pull-ups? Did heart rate keep climbing while your actual work rate fell? Those patterns are more actionable than the final average.
Long AMRAP
A 15- to 30-minute AMRAP gives heart rate enough time to settle and reveal pacing. A controlled start often produces a gradual rise followed by a relatively stable middle section. A start that is too aggressive may create an early spike, slower rounds, longer rests, and a high heart rate that no longer corresponds to productive work.
The Cindy pacing strategy already recommends finding a repeatable round time rather than attacking the opening minutes. Heart-rate data adds another layer: compare the first and second halves at similar round speeds. If heart rate climbs steadily while the pace stays similar, that may reflect normal cardiovascular drift, heat, hydration, or accumulating fatigue. If heart rate and round time both deteriorate early, the opening pace was probably not sustainable.
EMOM and interval work
An EMOM should often show waves: heart rate rises during work and falls during the remaining time. As fatigue accumulates, three changes may appear:
- The peaks become progressively higher.
- Heart rate falls less between minutes.
- The work takes longer, leaving less recovery.
Those changes are not automatically a problem. They show the cost of maintaining the prescription. If the goal was repeatable quality and the final minutes became survival, reduce repetitions, load, or work duration next time.
Heart rate is less precise for judging very short intervals because it cannot mirror every 10- or 20-second effort immediately. Use it to understand the overall session and recovery pattern rather than scoring each repetition.
Strength followed by conditioning
Heavy lifting can create sharp effort without the sustained heart-rate response of cyclical cardio. Long rests may keep much of the strength portion in low zones even when the sets are demanding. The conditioning piece then creates a second, clearly different pattern.
Do not conclude that the strength work “did not count” because its zone time was low. Heart rate captures cardiovascular response, not mechanical tension, neuromuscular fatigue, or local muscle damage. Keep strength metrics—load, repetitions, velocity, technique and proximity to failure—beside the heart-rate chart.
Why Average Heart Rate Can Mislead You
An average compresses the entire workout into one number. Warm-up, transitions, rest, failed repetitions and cooldown all influence it.
Imagine two athletes completing the same 20-minute AMRAP with an average of 165 bpm:
- Athlete A rises gradually, holds consistent rounds, and finishes hard.
- Athlete B spikes in minute four, slows dramatically, and spends the rest of the workout taking long breaks.
The average is identical; the performances are not.
Look at the timeline before the summary. Ask when the high-zone minutes occurred, what movement was happening, whether output remained stable, and whether the recovery periods worked as intended.
Check Whether the Data Deserves Your Trust
Optical wrist sensors are convenient, but movement, fit, skin contact, cadence, cold conditions, sweat and rapid changes in effort can affect their readings. CrossFit adds gripping, wrist flexion, kettlebell contact and abrupt transitions—all difficult conditions for a watch.
In a laboratory study of seven wrist-worn devices, most measured heart rate reasonably during common activities, but performance varied by device and activity; calorie estimates were substantially less reliable (Journal of Personalized Medicine). Another validation that included resistance circuits and intervals found larger errors in some high-intensity conditions (JMIR).
Before building a training decision around an unusual graph:
- Check for impossible vertical spikes or dropouts.
- Compare the reading with breathing and perceived effort.
- Wear the watch snugly and slightly above the wrist bone.
- Confirm that the correct workout mode was active.
- Use a compatible chest strap when accurate rapid-response data matters.
For a device-specific explanation, see how accurate Apple Watch heart-rate zones are. The correct takeaway is not that wrist data is useless. It is that a clean trend deserves more confidence than one strange sample.
A Seven-Step Post-WOD Review
Use this process after benchmark workouts and important tests:
- Write down the intended stimulus. Sprint, sustainable AMRAP, intervals, strength, skill, or recovery.
- Record the result. Time, rounds, repetitions, load and scaling.
- Compare intended and actual pacing. Use rounds, splits or machine output.
- Review the heart-rate shape. Look for the rise, stable sections, peaks, drops and late drift.
- Connect changes to movements. Note where grip, legs, breathing or technique forced a slowdown.
- Add context. Sleep, heat, hydration, stress, soreness, equipment and nutrition can explain unusual responses.
- Choose one change. Start slower, split a set earlier, adjust load, shorten work, improve measurement, or repeat the same plan.
One change is enough. A training log becomes confusing when every observation creates a new strategy.
Keep the review short enough that you will repeat it. A useful entry might say: “Planned steady 18-minute AMRAP; rounds slowed after minute 12; heart rate stayed high during longer chalk breaks; grip, not breathing, caused the slowdown; next time break the pull-ups two repetitions earlier.” That note connects the score, chart, limiting factor and next action without pretending that the heart-rate number explains everything. When you repeat the workout, you have a clear hypothesis to test.
Use Heart Rate to Improve Pacing, Not Control Every Rep
Heart rate is most useful when you compare similar workouts over time.
Suppose you repeat Cindy after six weeks. Your score improves from 18 to 20 rounds. That is already meaningful. The comparison becomes more useful if you also see that:
- Round times stayed consistent for longer.
- The same pace produced a lower heart rate in the first half.
- Heart rate recovered more during short breaks.
- The late rise happened closer to the finish.
- Your perceived effort was similar despite the higher output.
No single signal proves improved fitness, but the combined pattern supports the conclusion that the work became more economical and repeatable.
The same logic applies to Jackie. If you row faster but arrive at the thrusters unable to sustain your planned sets, the rowing improvement did not necessarily improve the workout. Compare the heart-rate rise, transition, thruster pace and total score as one system.
Common Interpretation Mistakes
Chasing maximum-zone time
More Zone 5 is not automatically better. The goal is the correct stimulus and the best sustainable output, not the most dramatic chart.
Treating zones as movement-specific load
Heart rate cannot fully capture the cost of heavy deadlifts, high-repetition eccentric work, grip fatigue or technical gymnastics.
Comparing different workouts as if they were tests
A hot outdoor run, an air-conditioned row and a barbell AMRAP are not interchangeable simply because they lasted 20 minutes.
Changing zone boundaries after one odd session
First check the sensor, conditions and workout structure. Change your settings only when repeated evidence shows that the zones do not agree with known effort and performance.
Treating recovery heart rate as a diagnosis
Heart-rate recovery is a real physiological signal. A landmark clinical study found prognostic value in a specific exercise-testing population (New England Journal of Medicine), but your watch after a WOD is not a clinical test. Compare recovery with your own similar sessions, and seek medical advice for symptoms such as chest pain, fainting, unusual breathlessness or palpitations.
The Practical Takeaway
Heart-rate zones make CrossFit data more useful when they explain the performance rather than replace it.
Start with the workout’s job. Read the shape instead of worshipping the average. Compare the graph with pace, movements, scaling and perceived effort. Check suspicious sensor data. Then make one practical decision for the next attempt.
Zone Training Log brings workout history, customizable heart-rate zones, notes, tags and time-in-zone summaries together, making it easier to preserve the context behind each WOD and compare patterns over time.
TAGSCrossFit heart rate, heart rate zones, WOD pacing, workout analysis, training log